A Framework for Understanding U.S. Treasury Auctions: What Every Market Participant Should Know: Example Included
Understand how the Government finances itself and what impact that has on the market

Introduction
As of May 20th, 2026, the national debt stood at $39.268 trillion. A number large enough that it is tough to reconcile mentally. The U.S. has never defaulted on its obligation, either. Through wars, depressions, financial panics, pandemics, and political dysfunction, the government has always found a way to finance itself. The mechanism by which they have done that is something that isn’t discussed as much as it should be…the public Treasury auction.
The government spends more than it collects in taxes resulting in an annual deficit that needs to be funded with debt. Congress determines how much the government can spend and the Treasury Department is then tasked with funding that spending in the form of collecting taxes and issuing debt. The Treasury issues new debt and manages the rollover of existing maturing debt. Gross issuance combines both rollovers and new debt. The scale of this task is difficult to overstate. In 2026 alone, the gross issuance the Treasury must auction is approximately $9.7 trillion in rollovers and approximately $2 trillion in new debt (deficit financing) totaling $11.7 trillion.
Acting on its own, the Treasury has no authority to create money. This separation of fiscal and monetary authority is a deliberate feature of the system. It was designed to prevent the direct monetization of government spending. As a result, the Treasury must rely on the auction system to raise the funds needed to finance the government.
What is a Treasury Auction
A Treasury auction is a competitive price discovery process that determines the rate (price) at which each security is sold. Participants submit either competitive or noncompetitive bids. A competitive bid includes the amount and specific yield an investor would buy the Treasury at, while a noncompetitive bid is one in which the investor will accept whatever yield the auction fills at. Treasury auctions use a format known as a Dutch Auction, with an important modification.
Unlike a typical pay-your-bid auction, the modified Dutch Auction clears at a single yield received by all winning bidders. The following example illustrates the basics of an auction’s basic mechanics.
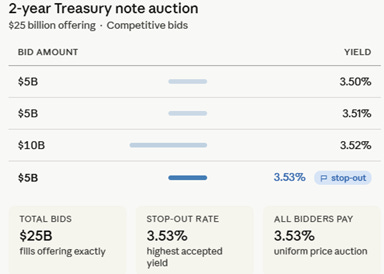
Below is a simple 2-year, $25 billion Treasury auction. For simplicity, assume no noncompetitive bids were submitted. The bids are listed from lowest yield (highest price) to highest yield. The bids are filled from the lowest yield to highest until the total offering amount is met, with all investors receiving the highest accepted bid, called the stop-out rate (high yield). In this case, bids came in at 3.5%, 3.51%, 3.52% and the highest accepted yield was 3.53%. All bidders receiving the stop-out rate removes the ‘winner’s curse’ from the auction, where investors would be hesitant to bid aggressively fearing they might be filled at an unfavorably low yield (which is a benefit to the government).
Auctions take the form of new issues and reopenings. A new issue is the initial offering of a security under a new CUSIP (security identification number). Once issued, it becomes the on-the-run security and thus the benchmark for that maturity. A reopening is when the Treasury sells additional amounts of a security that has already been issued and is currently trading in the secondary market. The reopened security carries the same CUSIP, coupon rate, and maturity date as the original security they are reopening, though the auction price adjusts to reflect prevailing market yields. The Treasury reopens a security to increase the liquidity and size for each offering. Without reopenings, the Treasury would need to create many unique CUSIPs across successive auctions, thus fragmenting liquidity across dozens of smaller issues. This makes it easier for large market participants to trade and hedge the on-the-run security.
Calendar and Quarterly Refunding Announcement (QRA)
The Treasury ensures that investors are aware of the upcoming auction dates and sizes to avoid unexpected market disruptions. This is accomplished through a layered framework by setting the strategic parameters in the Quarterly Refunding Announcement (QRA) and by maintaining a rolling master schedule that sets the tentative dates. These dates are then confirmed along with the size of the auction during the weekly and monthly announcements. Issuance is systematic and predictable across maturities, with each security type following a defined auction cycle. This predictable, pre-announced schedule allows market participants to plan positioning accordingly and ensures consistent demand across the maturity spectrum.
Treasury Bills: Treasury Bills are offered weekly (except the 52-week) and do not pay a coupon, instead they are issued at a discount to face value.
4-week & 8-week: Announced Tuesdays and auctioned on Thursdays.
6-week: Announced Thursdays and auctioned on the following Tuesday.
13-week & 26-week: Announced Thursdays and auctioned on the following Monday.
17-week: Announced Tuesdays and auctioned on Wednesday.
52-week: Offered once every four weeks. Announced Thursday and auctioned on Tuesday.
Cash Management Bills (CMB): Offered as needed.
These are short-term securities used to cover unexpected cash shortfalls and help manage the Treasury General Account (TGA) balance.
Treasury Notes (coupon-bearing securities, sometimes referred to simply as ‘coupons’ by market participants):
2-year: New issue monthly. Announced and issued towards the latter half of the month.
3-year: New issue monthly. Announced and issued towards the first half of the month.
5-year & 7-year: New issue monthly. Announced and issued towards the latter half of the month.
10-year: New issue in February, May, August, and November. Reopened in the intervening months. Auctioned during the second week of the month.
Treasury Bonds (when investors refer to ‘the long end’ or ‘duration,’ they are typically referring to these instruments):
The 20/30 year bonds follow the same issuance schedule of New/reopen/reopen as the 10-year note. The new issues are in February, May, August, and November with the reopenings in the months between.
20-year: Auctioned on the last Wednesday of the month.
30-year: Auctioned during the second week of the month.
TIPS (Treasury inflation-protected security)
5-year: New issues in April and October. Reopened in June and December. Auctioned next to last Thursday of the month.
10-year: New issues in January and July. Reopened in March, May, September, and November. Auctioned on the next to last Thursday of the month.
30-year: New issue in February. Reopened in August. Auctioned on the next to last Thursday of the month.
Floating Rate Notes (FRNs):
2-year (FRNs only): New issues in January, April, July, and October. The intervening months are reopenings. Auctioned during the last week of the month.
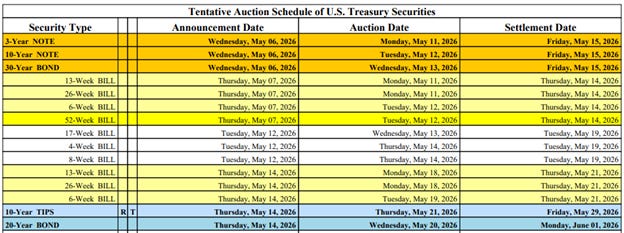
Below is a snip of the tentative auction schedule that is continuously updated by the Treasury. This is available online.
The QRA is one of the Treasury’s primary communication tools regarding upcoming financing needs. It is released on the first Wednesday of February, May, August, and November in two stages. The first stage is released on Monday with the borrowing estimates and then the full refunding statement on Wednesday. It outlines the refunding and the guidance for all auctions including new supply for the coming quarter, as well as the Treasury’s forward issuance strategy. The QRA process incorporates input from the Treasury Borrowing Advisory Committee (TBAC), a group of primary dealers and market participants that advises Treasury on financing strategy.
What market participants focus on most intently is the Treasury’s guidance on future coupon supply or the duration that the market needs to absorb. If the net new coupon supply exceeds market expectations, this can cause yields to rise sharply, as participants recognize that additional duration must be absorbed and that the Treasury may be shifting its financing strategy toward longer-duration issuance (the Investor Perspective section will cover duration in additional detail).
Auction Metrics
Each auction sees participation from a mix of market participants. Mathematically, the sum of the three participant groups must sum to 100%. Each is discussed below.
Participants:
Primary Dealers (Dealer takedown percentage)
A primary dealer is a financial institution that receives priority market intelligence and pre-auction consultation to the Fed’s open market operations in exchange for an obligation to bid at every Treasury auction. As of now, there are 26 primary dealers (prominent banks and broker dealers) who each of which must bid at least its pro rata share of the offered amount (at a reasonable yield), guaranteeing a demand floor and an auction that will not fail. Typically, dealers are viewed as the buyers of last resort, so if they end up purchasing a larger percentage of the auction, that is viewed as a poor auction. On top of that, dealers are primarily intermediaries (buy and sell Treasuries versus holding their own inventory). If they absorb a significant portion of the auction, they will be looking to offload those newly acquired Treasuries, thus putting upward pressure on yields as supply hits the secondary market. This dynamic of yields moving higher can materialize in the market after an auction with high dealer takedown. Because dealers are intermediaries and not long-term holders, they do not create demand in the long run as their holdings are short-term.
Indirect Bidders (Indirect takedown percentage)
An indirect bidder submits bids through a dealer or other intermediary on their own behalf rather than submitting directly in the auction system. In this arrangement, the dealer is acting as an agent for the end investor. These end investors are typically foreign asset managers, sovereign wealth funds, foreign central banks, insurance companies, and pension funds. The indirect bidder share is widely regarded as a proxy for overall foreign demand and real institutional demand (which can include domestic institutions routing through intermediaries). These investors tend to have a more structural demand that is less price sensitive, often seeking longer duration Treasuries. A high indirect takedown at an auction is considered a positive signal and is arguably the most important metric after the auction tail, which will be covered later.
Direct Bidders (direct takedown percentage)
A direct bidder submits bids directly to the Treasury auction system rather than working through a primary dealer. The direct bidder category consists of larger domestic institutions managing their own money and smaller retail investors participating directly via the TreasuryDirect. The direct bidder share has been gradually increasing as more institutions are linking directly to the Treasury to avoid the intermediation cost. The direct takedown is a meaningful demand signal, though it carries less weight than indirect takedown as an indicator of broader investor demand. A strong direct and indirect takedown of the auction together indicates that investors have absorbed the supply, and the dealers have less inventory to deal with.
Additional Auction Metrics
Investors use a list of metrics to determine how successful a specific auction was. Each metric needs to be measured against and together with the other metrics and referenced against past auctions. An overall score can be given that helps determine how successful it was relative to previous auctions. Some investors use a more algorithmic process to determine these scores whereas some use their expertise and experience. It is not an exact science. Each metric is discussed below.
The Tail
An auction is considered to “tail” when the stop-out yield (high yield) is greater than the when-issued (WI) yield. Before a Treasury security is officially auctioned, it begins trading on a forward settlement basis in the When-Issued (WI) market. This market acts as a real-time price discovery mechanism that investors can use when placing bids in the official auction. It is an important market as it allows market participants to hedge and set expectations ahead of the auction. Occasionally, the WI yield will move higher (cheaper auction) prior to the auction starting in an attempt to find the clearing level, this move higher is called concession building. When an auction tails, it indicates how much additional yield investors demanded at the auction relative to the WI yield. Auctions that tail need to be looked at relative to previous auctions of the same maturity. For example, if a 2-year note tails two basis points (bps), that could be significant, whereas a 30-year bond tailing two bps might get a shrug of the shoulders. A tail is generally interpreted as a sign of weak auction demand.
When the stop-out yield (high yield) clears below the WI yield, that means the auction ‘stopped through.’ Investors accepted lower yields than the WI market implied. This is a sign of competitive bidding and strong auction demand. When the stop-out yield is the same as the WI yield, the market refers to that as “on the screws.”
Evaluating an auction’s tail in the context of the takedown from direct, indirect, and primary dealers is recommended to make an accurate determination on the overall success of an auction. All else equal, if an auction stops through with higher indirect and direct takedown, that is a sign of strong end investor demand that absorbed the supply cleanly. It is uncommon to see an auction have a wide tail combined with high direct and indirect takedown. It is more common to see an auction tail and have primary dealer takedown increase, reflecting a dynamic of weak end investor demand with dealers needing to step in and absorb the remaining supply. Recall that dealers must place competitive bids that at least represent their pro rata share of the offering.
Bid to Cover
The bid-to-cover ratio is the total amount of bids divided by the auction’s offering amount. For example, a bid-to-cover of 2.5 would mean that there are $2.5 of bids submitted for every $1 of securities offered. This is a straightforward measure of total auction demand, but does not take into consideration the yield portion of the competitive bid. For example, a high bid-to-cover combined with a tail indicates the demand was there, but investors required higher yields than the WI yield implied, which is a mixed signal usually interpreted with a negative bias. Healthy bid-to-cover ratios vary by maturity, with shorter-dated securities typically attracting higher ratios than longer-dated ones.
Allotted at High Yield
The allotted-at-high yield is the percentage of competitive bids submitted at the stop-out yield (high yield) that were filled. This provides insight into where demand was concentrated in the order book. This is a more nuanced metric that cannot be viewed in isolation as it requires context from other metrics to be meaningful. If the allotted percentage is low (not as many bids sitting at the high yield) and the auction stopped through, that would be considered strong demand and more aggressive bidding from investors. If the allotted percentage is low while coinciding with a tail, this suggests more reluctant end investors, especially if primary dealer takedown is high. A high allotted percentage suggests a thin order book and a weaker auction as investors crowd on a specific yield. This becomes particularly concerning when the allotted percentage approaches 100%, suggesting the auction barely covered at the margin.
Price Move Post Auction
After the auction clears and the results are released, investors and market participants react immediately. This is an important real-time signal that reflects the attitude towards the auction. Generally, as a standalone metric, rising yields following an auction are interpreted as a weak reaction, while falling yields suggest a strong one. For example, if the auction was weak with a higher dealer takedown, the market may be trying to front-run dealers that have to offload some of that inventory. Or Treasuries could rally (yields fall) after a strong result as it confirmed that end investors are still looking to fill demand at those levels. Pay attention to how yields react immediately after, where they trade a half-hour later, and into the close. Ultimately, how yields move after an auction can tell a more important story than the auction itself.
Auction Example:
May 20th, 2026, the Treasury auctioned $16 billion in 20-year bonds.
Market Context:
Going into the 20-year auction, the backdrop was uneasy and volatile. The Iran conflict combined with the closure of the Strait of Hormuz has disrupted approximately 20% of the global oil supply, as well as critical fertilizer (sulfur & ammonia) used for growing food. This has resulted in a squeeze in energy and commodity prices, translating to elevated inflation (April CPI 3.8% y/y), ultimately pushing global bond yields higher. The U.S. 30-year reached 5.19% (highest since 2007). Equity markets remain near all-time highs but have seen some selling pressure as the surge in yields has started taking its toll. Investors were watching the upcoming 20-year Treasury auction with interest to gauge whether the high yields bring in real demand or if investor sentiment towards rates has deteriorated. One thing to note, the 20-year is generally considered the least liquid of the benchmark maturities and typically carries a concession relative to the 10 and 30-year.
Auction Results:
Here are the metrics that the auction posted. After we can determine how successful it was.
Tail: High Yield 5.122% vs. WI of 5.122%: No tail. On the Screws.
Bid to Cover: 2.55x
Indirect takedown: 67.67%
Directs takedown: 22.94%
Primary Dealer: 9.39%
Market reaction post auction: the 20-year yield traded relatively flat immediately after the auction and into the close.
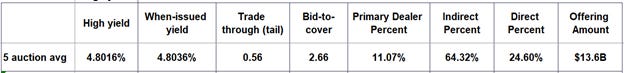
Scoring: (the data for the past five 20-year auctions is used and provided below)
The first thing to note is that this can be as systematic as made to be. Most auction grades are informal and subjective based on prior experience determining auction success and market reactions. This is another tool in a macro toolkit to ultimately further understand why the market moves. A letter-grade scale will be used below of A, B, C, D, and F (failed auction).
1. Tail: C. In this case, the high yield and WI were the same (on the screws). Of the five prior auctions, four stopped through with an average stop-through of 0.56 basis points. Overall, positive that the auction didn’t tail, but was worse than the past five average.
2. Bid-to-Cover: B. At 2.55x, that is in line with historical averages for this maturity. A reading below 2.3x would generally be considered indicative of weak demand. The past five auctions averaged 2.66x, slightly above this past auction.
3. Indirect takedown: A. 67% is a level where investor demand showed up. This was relative to the 64.32%, the average of the past five auctions. Elevated indirect takedown mathematically compresses direct and dealer shares.
4. Direct takedown: B. At 22.94%, this was slightly below the five-auction average of 24.6%. When there is a higher indirect takedown, this will push direct and dealer takedown lower.
5. Primary Dealer takedown: A. Given this is the remaining takedown after subtracting the indirect and direct, a reading below 10% is considered a strong result. The average was 11.07%.
6. Market reaction: B. The 20-year Treasury yield stayed flat post auction result release and drifted lower into the close, indicating no immediate adverse market reaction.
Overall Score: B
This was an overall good auction that showed end investor demand was present despite the volatile backdrop. The primary reason a B score was given instead of an A was because the tail didn’t stop through like four of the past five auctions.
(Average of the past five auctions)
Investor Perspective
Duration, Supply, and the Fed:
The primary objective of the Treasury is to finance the government at the lowest cost over time. Debt is issued across the yield curve up thirty years. The yield curve is typically upward sloping so that naturally makes T-bills cheaper (lower yield) relative to longer duration coupon notes and bonds. Bills are also more flexible as the market absorbs them easily given the structural demand compared to notes and bonds. Bills have a large base of price-insensitive buyers such as money market funds, banks, foreign central banks, and corporations. However, issuing too many bills results in higher rollover risk as the interest cost of the debt reprices quickly when rates move higher. A sudden rise in yields significantly increases total interest expense as maturing securities are rolled over at higher rates. The suggested range of bills is 15-20% of outstanding marketable debt. Coupons on the other hand give the guarantee of a locked-in rate, with the tradeoff of a higher fixed rate and reduced financing flexibility. Below is the current debt profile of the U.S.
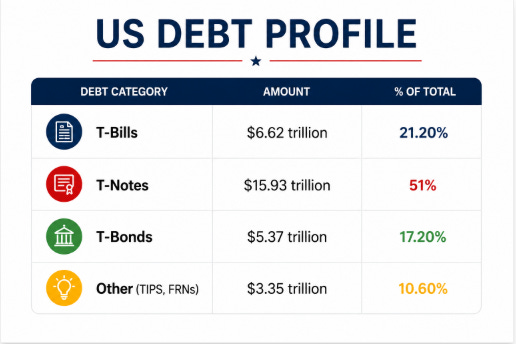
The weighted average maturity (WAM) is the total average duration of all Treasury debt. The WAM currently stands at approximately 70 months (5.9 years), which is above the historic average. The average interest rate on all marketable debt is 3.35%, implying a total annual interest expense of approximately $1.05 trillion (the actual calculation is slightly different).
Duration Impact and the Fed
From an auction perspective, the critical variable driving long-end rates is the net supply of coupon Treasuries that the private market must absorb. This directly drives duration demand and term premium pricing. The term premium is the excess yield that investors demand for holding duration risk. When additional coupon supply enters the market, investors may require a larger term premium, which can push yields higher. Higher yields weigh on consumers due to lending that is benchmarked to long-term yield, and on risk assets as their valuations are compressed.
The other player in town is the Fed. The Fed influences private sector duration absorption through its balance sheet policy, specifically quantitative easing (QE), quantitative tightening (QT) and its reinvestment policy. To put it simply, that is what the Fed buys, what the Fed sells, and what the Fed chooses to reinvest when securities mature in its System Open Market Account (Fed’s total portfolio of Treasury and agency securities known as SOMA). When the Fed is purchasing bonds, this removes duration from the private market. When selling or allowing securities to roll off, this increases the duration the private market needs to absorb. The last variable is the SOMA account. When bonds mature and need to be rolled over, this can add or remove supply from whichever part of the curve it is targeting. Together, the Fed and Treasury ultimately determine the amount of duration that the private sector absorbs.
Below is a simple identity that can provide guidance on the net duration impact of the Fed and Treasury:
Net Private Duration Supply = Treasury Net Coupon Issuance − ΔFed SOMA Coupon Holdings
The Fed may participate in an auction through a noncompetitive bid when reinvesting maturing principal. This is called the add-on rule. If the Treasury’s total auction is $10 billion and the Fed rolls over $3 billion, the Treasury would issue $13 billion in total, with the additional $3 billion representing the Fed’s reinvestment.
Great post:) Thanks for the example